GSS 技術部落格
在這個園地裡我們將從技術、專案管理、客戶對談面和大家分享我們多年的經驗,希望大家不管是喜歡或是有意見,都可以回饋給我們,讓我們有機會和大家對話並一起成長!
若有任何問題請來信:gss_crm@gss.com.tw
1 分鐘閱讀時間
(117 個字)
chromium 內核 developer tools 中-分析js效能瓶頸的好用工具

不管是Chrome 還是 Edge Chromium
只要是使用Chromium的瀏覽器都可以使用按下F12開啟Developer Tools
預設是沒有這個分頁的
要自行開啟
預設是沒有這個分頁的
要自行開啟
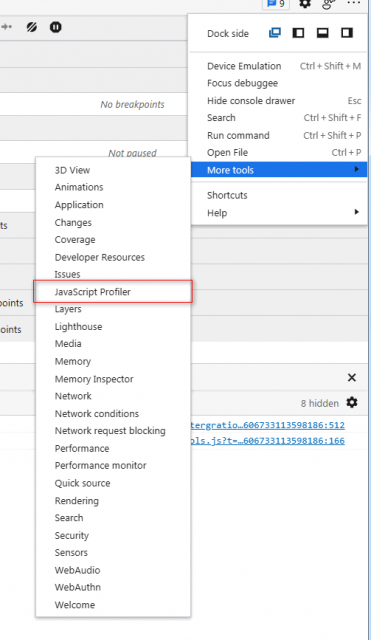
開啟之後就會多一個JavaScript Profiler的分頁
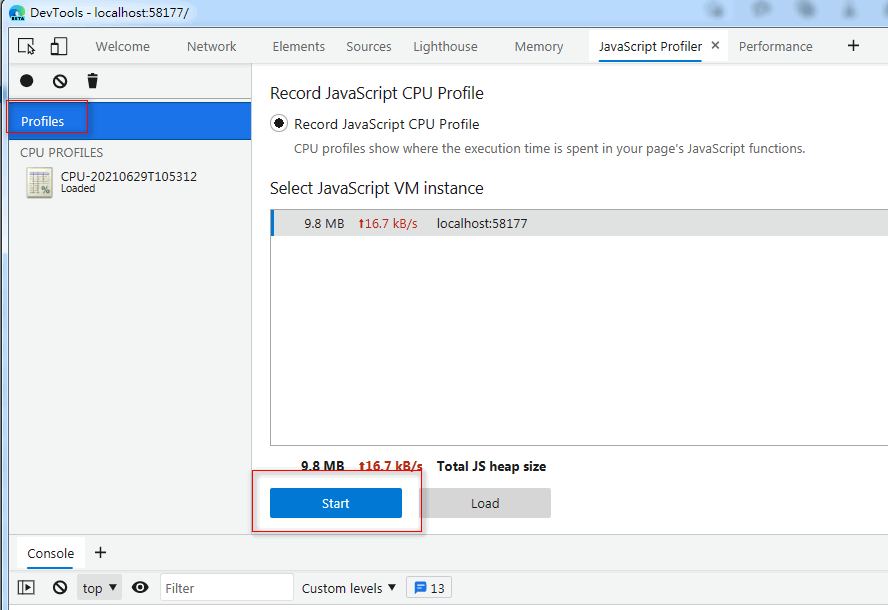
按下Start即開始記錄
*建議可以debugger停下在想要開始記錄的地方再按下start ,而按下之後 debugger就不會在被觸發停下.
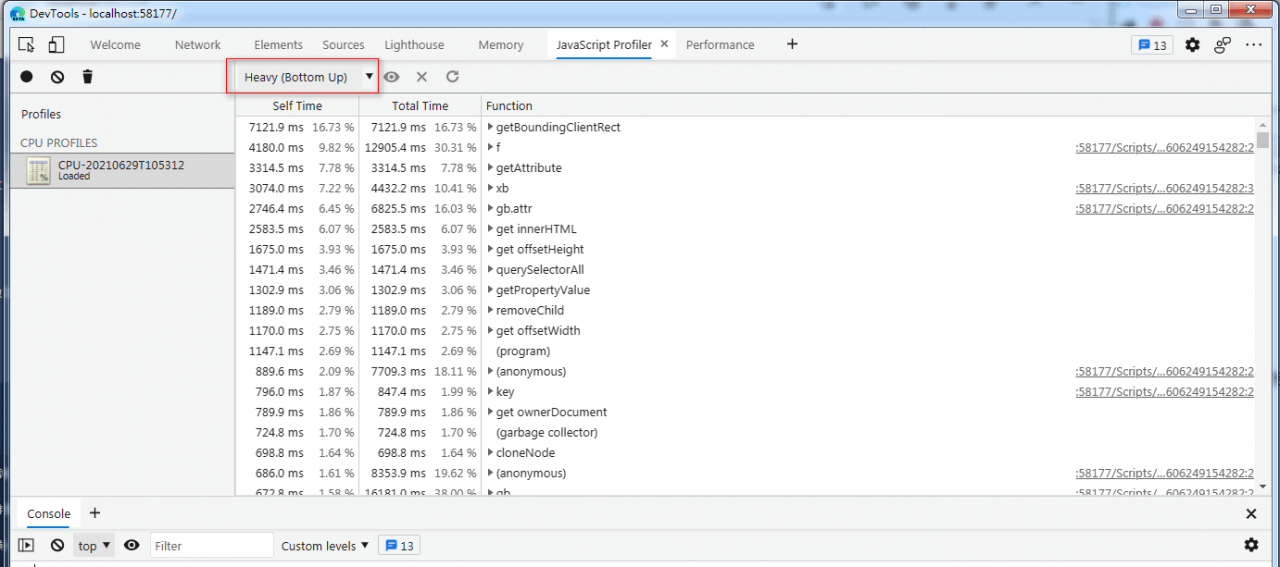
記錄完成之後會得到一個heavy的結果
可以用文字的方式看出哪個fn執行較花時間
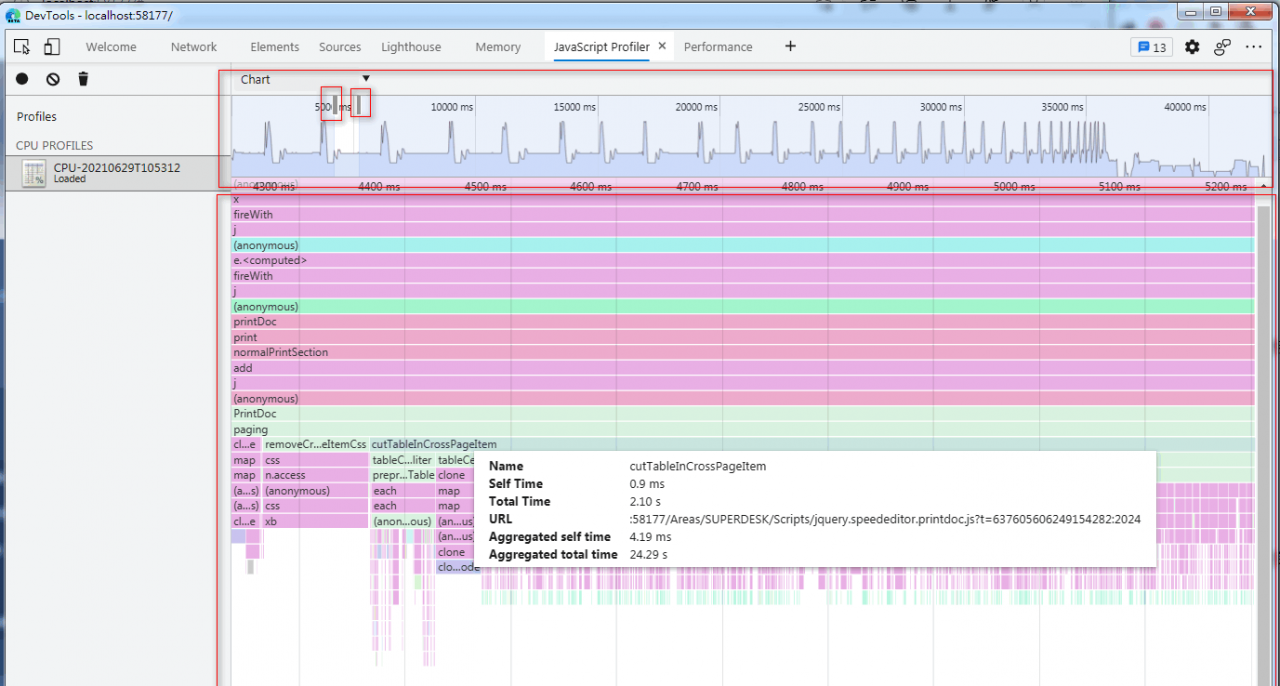
我推薦將heavy改成Chart
chart結果分兩個區塊
上方可以使用滾輪縮放要檢視的範圍
也可以自由拖動改變大小
下方為圖像化排列占用的時間軸
滑鼠移上去可以看到該fn所占用的時間
一般要解效能就挑那些Aggregated total time 多的來修.
可以看到圖上cutTableInCrossPageItem就占了大約40秒中的24.29秒
所以我們就先拿它開刀.
Stay Informed
When you subscribe to the blog, we will send you an e-mail when there are new updates on the site so you wouldn't miss them.
評論